Why this project?
For a country of 1.2 billion people, India doesn't have a single public data portal that provides easy access to crime data. Getting India's crime data has always been painful. The National Crime Records Bureau releases an annual report more than 600 pages long, detailing the different kinds of crimes recorded in the country. Below is a screenshot from the latest report i.e. 2014.
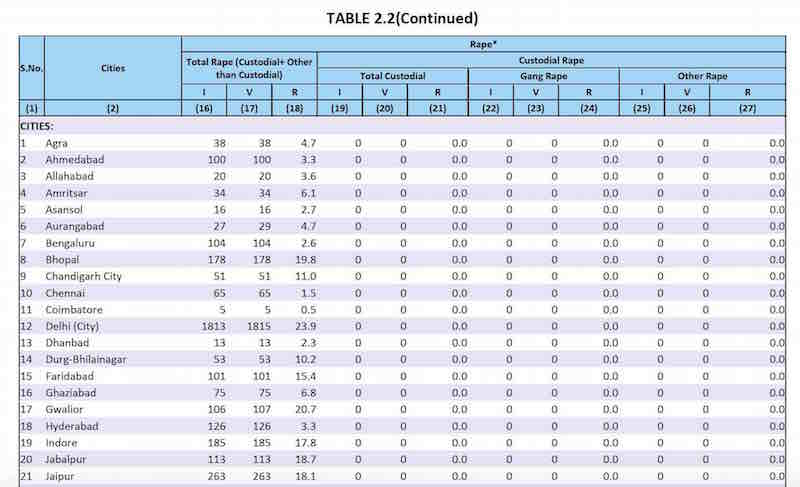
This report goes on for hundreds of pages with different tables and charts. Every year, journalists, social scientists, academics and anybody else interested in this data spend hours ploughing through these dense PDF documents to analyze and process this information.
And if you want to compare crimes across cities and different years, all you can do is download the PDFs for each year and manually put together a spreadsheet for analysis.
How does this website help?
This application frees the data trapped in these PDFs, so that you can easily compare crimes in different cities and across different years. You can choose a city and know which crimes are affecting its people the most. Or you can choose a crime and know which cities have the highest rates of that particular crime.
We've made it easy for you to discern trends and patterns from the five latest available data sets for crimes in India i.e. 2010 to 2014. You don't have to download any PDF documents or convert them into spreadsheets.
The data
The data comes from India's National Crime Records Bureau, which releases a compiled report of crimes recorded by police stations all around the country. The app has data from 2010 to 2014 i.e. the five latest years of data available. The latest report can be found here. Reports from the previous years can be found here.
There are some assumptions and modifications to the data that are necessary to point out.
-
Cities and average crime rate: The Bureau didn't report crimes for 18 cities in 2010. These cities were added in consequent years. While calculating average for such cities (Chandigarh, for instance), the average is for over a four-year period (2011 - 2014). This, we believe, is still a better choice than to consider 0 as the crime rate for 2010, since that would present a drastically skewed picture.
-
Categories: The Bureau categorizes crimes as 'violent', 'crimes against women', 'property crime', 'economic crime', and so on. We have followed the same nomenclature. You can see their categorization here[pdf].
Furthermore, in order to make navigation of data easier and the analysis more lucid, we have restricted ourselves to displaying a smaller subset of all the crimes recorded in the original data. These include the most serious crimes in each category and provide a fair insight into the criminal makeup of each city:
-
Crime rates for women: From 2010 to 2012, the Bureau recorded rate of crimes against women using the total population. In no way does this reflect the true picture. Hence, we did our own calculations of crime rates for all crimes against women using the 2011 Census provisional population totals[xls].
-
New category: We have also added a new category for crimes against women: 'Sexual harassment and molestation of women' . This is because of the lack of consistency in the way the Bureau reports sexual crimes against women that are not rape i.e. Section 354 and Section 509. In 2010 and 2011, crimes recorded under these sections were reported as 'Molestation' and 'Sexual harassment' respectively. The following years, they were reported as 'Assault on women with intent to outrage modesty' and 'Insult to the modesty of women'.
We first standardized the nomenclature across all years. Section 354 crimes were named 'Assault on women with intent to outrage modesty' and Section 509 crimes were placed under the 'Insult to the modesty of women' head.
We then added our new category 'Sexual harassment and molestation of women' by adding the number of incidences for crimes under the aforementioned two sections. We then calculated the crime rate for this new composite category using the 2011 Census population numbers.
Why do this? Combining the two sections provides a simpler way of understanding the rates of sexual harassment and molestation women face. These are not crimes as severe as rape. However, these crimes make life for women much more difficult since they experience them on a regular basis in their everyday lives.
-
Hurt: Until 2013, the Bureau recorded assault crimes i.e. crimes for injuring people through various means under the 'Hurt' category. These were crimes recorded under Sections 323-333, 335-338, all of them dealing with causing bodily harm to people. However, in 2014, the Bureau started reporting crimes under the head of 'Grievous Hurt', with sub-categories that included crimes like acid attack, attempt to acid attack, etc. We have reported these crimes under the 'Hurt' category for 2014. The sub-sections also appear on the app, but we have mainly considered the overall 'Hurt' crimes for our reporting.
- Here is a list of crimes we have chosen to display:
Violent Crimes: Attempt to commit murder, Culpable homicide not amounting to murder, kidnapping & abduction, murder, and riots
Crimes Against Women: Cruelty by husband or his relatives, dowry deaths, rape, and sexual harassment and molestation of women
Property crimes: Arson, auto theft, burglary, dacoity, Other theft, and robbery
Economic crimes: Cheating, criminal breach of trust, counterfeiting and forgery
Credits
This application was built by Saurabh Datar as part of his thesis project for the Stanford Journalism program. It would not have been possible without the guidance of Dan Nguyen and all other professors at the Department of Communication at Stanford University.
The icons used on the home page have been designed by parkjisun from The Noun Project.
The map of India is courtesy Datameet. It was converted to a TopoJSON using mapshaper.
Technical details
Since the data came in PDFs, ABBYY FineReader (courtesy Dan Nguyen) was used to convert them into spreadsheet format. The data cleaning was done in Python, with the occasional use of Pandas for wrangling and pivot tables.
The app itself is powered by Python's Flask framework. The website mainly uses Bootstrap for styling and responsive design. The visualizations are powered by Highcharts. The map on the front page is made in D3.